Group financial performance
Group financial summary


Overview of results

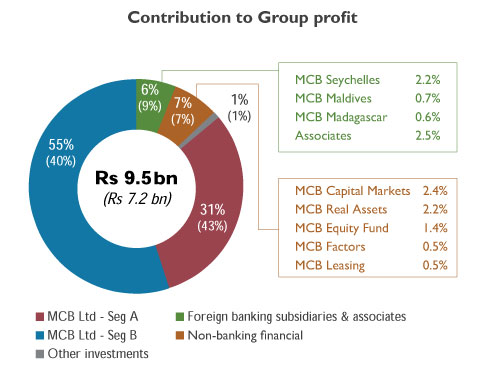
Although the operating context remained challenging across markets, the Group posted a strong performance for the year ended June 2019, underpinned by the active and thoughtful execution of its diversification strategy. Operating income recorded an increase of 19.3% to reach Rs 20,226 million, with a broad-based improvement in performance observed across the banking and non-banking clusters, more particularly on the international front. This has contributed to a growth of 31.3% in attributable profits to stand at Rs 9,482 million, with the combined share of foreign-sourced income and non-banking operations standing at 69% thereof.
The Group upheld its financial soundness in FY 2018/19, as gauged by an improvement in asset quality and capital adequacy ratios alongside the maintenance of healthy funding and liquidity positions.
![]() More info in Risk and Capital Management Report section
More info in Risk and Capital Management Report section
At Company level, dividend income amounted to Rs 3,370 million for the period under review. After allowing for operating expenses of Rs 164 million, profit for the Company stood at Rs 2,923 million for the period ended 30 June 2019. Overall, total assets of the Company amounted to Rs 13,890 million as at 30 June 2019, with investments in subsidiaries and associates standing at Rs 11,232 million.
Outlook for FY 2019/20
Looking ahead, the Group will pursue its expansion strategy anchored on sound foundations, backed by continued investment in human capital and technology amongst others. While paving the way for the next development phase, we aim to further improve our resilience in the face of the highly dynamic operating environment characterised by challenges on various fronts, be they regulatory, technological or economic. Against this backdrop, supported by our activities in the region in particular, Group results should improve further in FY 2019/20, albeit at a reduced pace given the strong performance achieved this year.
Income statement analysis

- An increase of 24.7% in interest income to Rs 18,841 million on the back of improved performances across banking subsidiaries, notably at the level of MCB Ltd, which witnessed a significant increase in its international loan portfolio and improved yields on Government securities.
- A rise of 34.2% in interest expense to Rs 5,885 million, mainly due to an increase in borrowings at the level of MCB Ltd to support its international business growth.

- A growth of 10.3% in net fee and commission income to Rs 3,786 million, reflecting enhanced contribution from MCB Capital Markets Ltd and higher revenues across banking subsidiaries, with notable growth being registered in respect of the Energy & Commodities business and payment services at the level of MCB Ltd.
- A rise of 24.9% in ‘other income’ - in spite of a subdued performance in profit on exchange and lower gains on disposal of investments by MCB Equity Fund Ltd - mainly driven by:
- Fair value gains on financial instruments at the level of MCB Equity Fund Ltd and, in particular, MCB Ltd, with the latter posting significant gains on equity instruments, now included in the ‘statement of profit or loss’ following the adoption of IFRS 9.
- Higher contribution from entities in the non-banking segment, in particular MCB Consulting Services Ltd and MCB Real Assets Ltd, the latter benefiting from increased rental income and fair value gains on its investment property.

- A rise of 13.1% in staff costs, which represented 57% of the cost base, on the back of the Group’s sustained efforts to reinforce its human capital and higher performance bonus amidst increased profitability.
- A growth of 3.6% in depreciation and amortisation costs following continued investment in technology.
- An increase of 8.4% in other expenses, following higher advertising and marketing costs as well as a rise in other software and IT related costs.
Operating income having grown at the higher pace of 19.3%, our cost to income ratio improved by 3.0 percentage points.

Whilst impairment charges registered a growth of 20.1%, the cost of risk in relation to loans and advances dropped marginally to 59 basis points of the latter.

Notwithstanding a reduced contribution from BFCOI, our share of profit of associates grew by Rs 97 million, on the back of improved performances of Société Générale Moçambique and Promotion and Development Group.

Whilst profit before tax improved by 26.3%, tax expenses increased by only 2.4%, notably reflecting the higher proportion of foreign sourced earnings, which bear a lower effective tax rate, at the level of MCB Ltd.
Financial position statement analysis

Gross loans of the Group recorded a year-on-year growth of 14.5% in FY 2018/19, with most banking subsidiaries posting an increase in their loan book. Specifically, gross loans at the level of MCB Ltd registered an increase of 14.0%, largely explained by the continued expansion in its foreign activities, with related credit to customers increasing by 32.5%, mainly associated with the Energy & Commodities business and structured project financing activities. At domestic level, notwithstanding an increase of around 8% in the retail segment, mainly underpinned by growth in mortgages, the overall loan portfolio expanded by only 2.7%, reflecting the still challenging operating context and the recourse to other financing instruments by some operators. Indeed, exposures through corporate notes at Bank level rose further to Rs 17.3 billion, up from Rs 7.0 billion last year.
The quality of our credit portfolio improved further during the year. Gross NPL ratio declining to stand at 4.1% while net NPL ratio stood at 2.9%.

Total deposits of the Group increased by 11.3% to attain Rs 332 billion as at 30 June 2019, supported by a broad based increase across banking subsidiaries. In particular, MCB Ltd recorded a rise of 10.1%, following a growth of 15.6% in foreign currency deposits and 7.0% in rupee-denominated deposits. ‘Other borrowed funds’ increased by Rs 42.5 billion, in line with initiatives undertaken by MCB Ltd to promote a sound and diversified funding base to support its international business. In addition to the syndicated term loan facility of USD 800 million, the Bank had recourse to credit facilities of USD 150 million obtained from Development Financial Institutions in order to finance long-term projects domestically and in the region.

Liquid assets of the Group grew by 26.4% during the last financial year. This was characterised by: (i) an increase of 24.4% in cash and cash equivalents, including placements, mainly through money market instruments; (ii) a rise of 32.2% in investment securities (excluding shares and corporate notes); and (iii) a growth of 9.2% in mandatory balances with Central Bank.
Overall, the above-mentioned liquid assets as a percentage of the funding base stood at 46.2% as at 30 June 2019 (FY 2017/18: 45.2%).

In line with the strong performance of the Group, a final dividend of Rs 7.60 was declared in September to be payable in December 2019 following an interim dividend of Rs 5.40 per share paid in July, bringing the total dividend per share to Rs 13.00. This represents a growth of 30% compared to previous year, with the dividend payout ratio standing at some 33% of earnings.
Shareholders’ funds increased by 9.6%, after accounting for retained earnings of Rs 6.9 billion for the year and the impact of adopting IFRS 9, by way of an adjustment to the opening balance of retained earnings and other reserves. The Group maintained comfortable capitalisation levels with the BIS ratio standing at 17.4% as at 30 June 2019, of which 15.8% by way of Tier 1.
© 2019 MCB GROUP LTD #Success Beyond Numbers

